Our 4-Step Pipeline
From national-scale geofencing to Getty-ready site packages
STEP 1
National-Scale Geofencing
We built the most precise truck-stop geofence database in the industry through 500+ hours of manual labeling.
- 1,800 major truck-stop polygons covering TA, Love's, Pilot Flying J, and other national chains
- 1,000 strong non-major facilities including regional chains and high-performing independents
- 1,800 parking sub-polygons with manual overnight dwell classification
- Hourly presence heatmaps revealing peak demand windows and capacity constraints
Why This Matters: Algorithmic geofences miss parking lots, misclassify diesel bays, and blur facility boundaries. Our manual precision enables accurate cohort-to-gallons mapping that Getty's IC can trust.
STEP 2
Trucker Cohort Mobility Dataset
We filter 180,000 devices exhibiting trucker behavior patterns—the most accurate fuel-demand proxy available.
- 180,000 active devices continuously tracked across U.S. highway corridors
- 10-meter accuracy enabling precise facility attribution
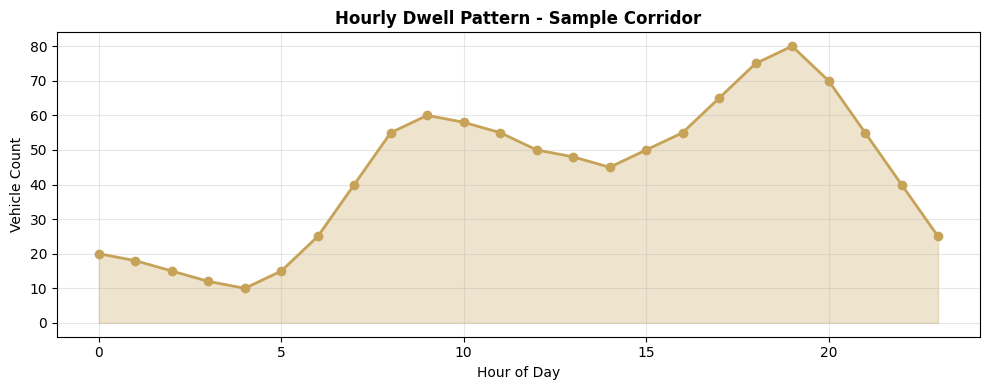
- 15-minute ping resolution revealing hourly demand curves and overnight dwell patterns
- Behavioral filtering isolates true trucker patterns from passenger car noise
- Hour-of-day presence heatmaps showing when lots fill and when demand peaks
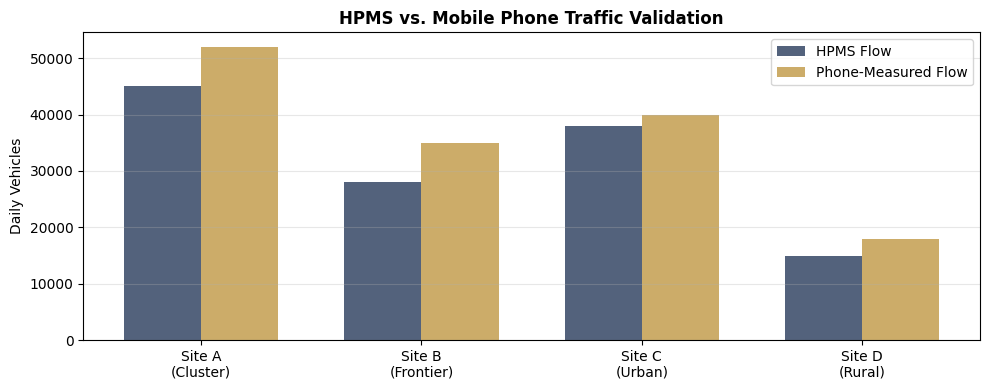
Getty Advantage: HPMS provides both all-vehicle and Class 8 truck counts; our cohort isolates actual diesel-buying behavior patterns. This removes the guesswork from fuel demand forecasting.
STEP 3
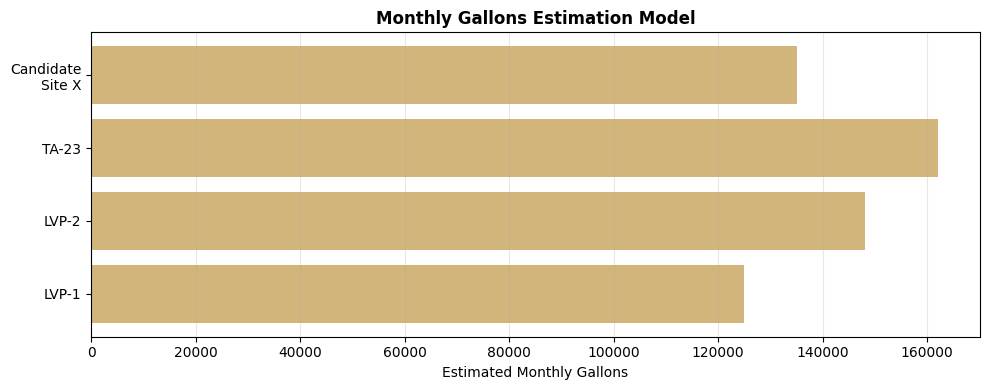
Gallons Estimation Engine
We reverse-engineer actual fuel sales from known LVP sites, then generalize that model to all 1,800 major facilities and every candidate parcel.
- Known gallons baseline from LVP partnership sites with verified sales data
- Visit-to-gallons mapping correlating cohort visit frequency to actual monthly fuel volume
- Model generalization across all TA, Love's, Pilot facilities nationwide
- Candidate scoring assigns each prospective site its own gallons proxy
- Confidence intervals quantify forecast precision for Getty underwriting
Getty Confidence: This is not a traffic study proxy—it's real fuel demand measured from actual trucker behavior, validated against known sales.
STEP 4
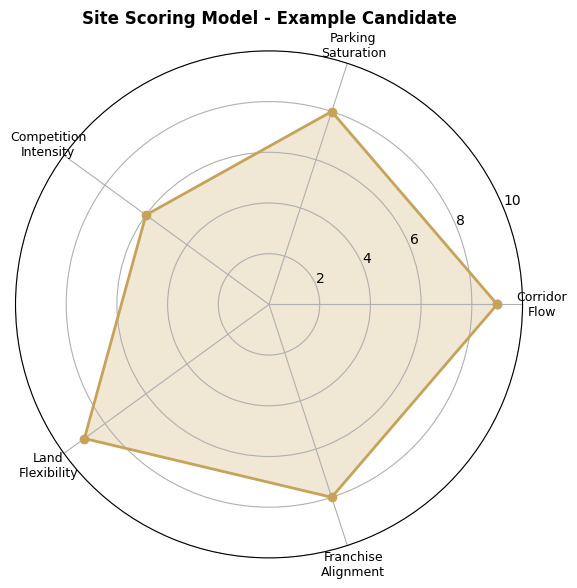
Comprehensive Scoring Model
Every candidate site receives a multi-dimensional risk score covering demand, competition, saturation, and real estate fundamentals.
- Corridor flow scoring using both HPMS and phone-measured traffic
- Parking saturation probability from overnight dwell fill curves
- Competitive intensity analysis within 5-mile radius (cluster vs. frontier designation)
- Land flexibility assessment for fallback alternative uses (QSR, C-store, EV, logistics)
- Franchise alignment scoring for TA/LVP operational fit
Getty IC Receives: Transparent, auditable scoring with no black-box algorithms. Every metric ties back to verifiable data sources.
What Getty's Investment Committee Receives
Data Package
- Parcel geometry and ingress/egress analysis
- HPMS vs. phone-measured flow comparison
- Cohort-based gallons proxy with confidence intervals
- Competition cluster map (5-mile radius)
- Parking saturation curves and overnight dwell metrics
Risk Assessment
- Fallback alternative-use scoring
- Real estate fundamentals independent of operator
- Demographic and employment trends
- Environmental and zoning pre-clearance
- Comparable sales analysis
Getty-Ready Deliverables
- Executive site brief (3-5 pages)
- Visual demand validation dashboards
- NDA-protected methodology appendix
- Franchise alignment assessment
- Data room access for deep-dive due diligence