Our Data Advantage
Why our mobility cohort and manual geofencing delivers superior accuracy
180,000-Device Trucker Cohort
Unlike HPMS or generic traffic counts, our mobility cohort isolates actual diesel buyers—the only metric that matters for Getty underwriting.
- 10-meter accuracy when devices are stationary, enabling precise facility attribution
- 15-minute ping resolution reveals hourly demand curves and overnight dwell patterns
- Behavioral filtering removes passenger car noise and isolates trucker-specific patterns
- National coverage across all interstate and major U.S. highway corridors
- Multi-year historical data showing demand stability and seasonal patterns
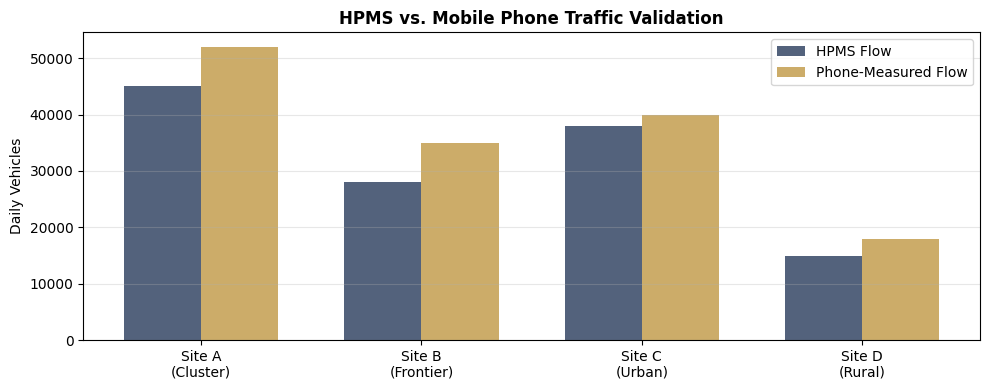
HPMS vs. Phone-Measured Flow
| Metric | HPMS (DOT Standard) | Milepost Phone Data |
|---|---|---|
| Counts What | All vehicles (cars, trucks, motorcycles) | Only devices with trucker behavior patterns |
| Accuracy | Corridor-level averages, often outdated | 10m precision, sub-polygon resolution |
| Temporal Granularity | AADTT (annual average) | Hourly, by day-of-week |
| Fuel Demand Proxy | Indirect (requires conversion factors) | Direct (mapped to actual gallons sold) |
| Getty IC Confidence | Moderate (generic traffic study) | High (validated against known LVP sales) |
Our Moat: 500+ Hours of Human-Labeled Geofences
Algorithmic geofences fail where precision matters most. We manually labeled every critical boundary.
TA, Love's, Pilot, and other national chains with precise diesel bay boundaries
Regional chains and high-performing independents often missed by generic datasets
Overnight dwell classification enabling saturation analysis
Manual precision that competitors cannot replicate at scale
Why Manual Geofencing Matters for Getty
Algorithmic geofences misclassify parking lots, blur diesel bays with gas pumps, and miss sub-facility nuances. This creates noise in demand estimation that Getty's IC cannot tolerate.
Our manual precision enables cohort-to-gallons mapping with auditable accuracy—the foundation of every site package we deliver.
Richer Signal Quality Near Clusters
Mobile phone pings provide higher accuracy and denser coverage in high-traffic cluster areas—precisely where Getty wants validation confidence.
Cluster Strategy Advantage
- Higher HPMS baseline flows generate more mobile device pings
- Parking fill curves show overflow demand with statistical confidence
- Competition proximity increases signal density for comparative analysis
- Getty IC receives stronger validation for lower-risk opportunities
Why Cluster Wins Over Frontier
- Cluster provides comparative parking data from nearby competitors—frontier lacks neighbors
- Getty IC receives stronger demand validation with proven overflow patterns
- Lower risk profile: cluster demand already validated by existing facilities
- While frontier offers higher alpha, cluster offers Getty-preferred certainty
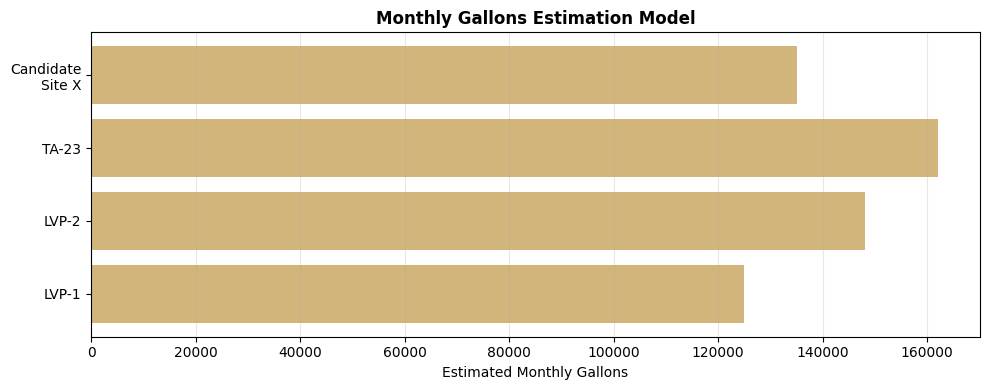
Validation Against Known LVP Sales
We don't just measure visits—we map them to actual gallons sold at partnership sites, then generalize that model nationwide.
- Known gallons baseline from LVP operational data
- Visit-to-gallons correlation with statistical confidence intervals
- Model generalization across all 1,800 major truck stops
- Candidate site scoring with Getty-ready forecast precision
See How Data Drives Site Selection
Explore our cluster vs. frontier strategy framework.
Cluster vs Frontier