Parking Saturation Module
How overnight dwell detection reveals immediate co-location opportunities
Why Parking Saturation Matters to Getty
Parking capacity is the leading indicator of unmet demand in the truck-stop industry. When lots fill to 90%+ occupancy multiple nights per week, overflow demand creates immediate co-location opportunities.
- Federal HOS rules mandate 10-hour rest breaks, creating predictable parking demand
- Capacity constraints force truckers to continue driving or park illegally
- Overflow demand is quantifiable and validates adjacent development
- Getty IC confidence: saturation = proven demand with minimal underwriting risk
Our Methodology: Sub-Polygon Overnight Dwell Detection
We manually labeled 1,800 parking sub-polygons separate from diesel bays and C-store areas. This precision enables:
- Isolation of overnight dwell (8pm–6am) from daytime refueling visits
- Hourly parking occupancy curves by day-of-week
- Peak saturation identification (Wed–Fri most critical)
- Statistical confidence intervals for Getty underwriting
- Comparison across competitive facilities within 5-mile radius
- Seasonal pattern analysis (holiday peaks, harvest surges)
- Overflow quantification (trucks parking beyond capacity)
- Co-location opportunity scoring
Parking Fill Curves: From Data to Decision
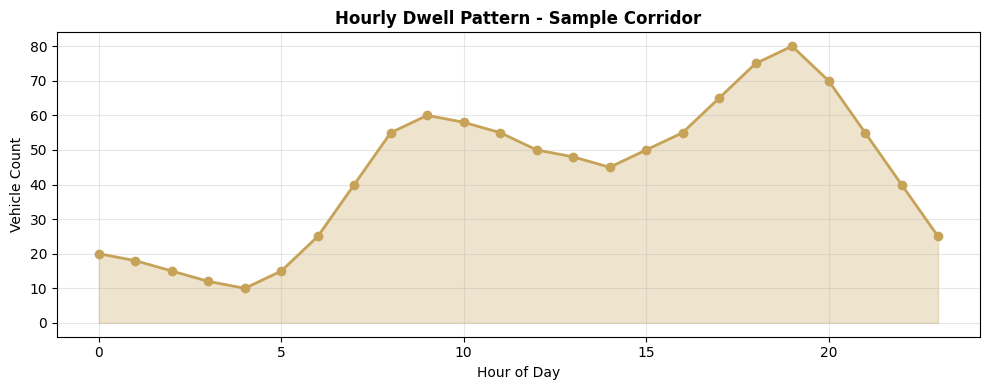
Interpreting the Fill Curve
- 6pm–8pm: Rapid fill as truckers complete HOS hours
- 8pm–midnight: Peak saturation (90%+ occupancy = overflow)
- Midnight–4am: Sustained occupancy (true overnight demand)
- 4am–6am: Early departures for next-day deliveries
How Saturation Informs Site Selection
Identify Saturated Facilities
Our cohort monitors 1,800 major truck stops for recurring 90%+ occupancy patterns. These become "anchor" sites proving unmet demand.
Map 5-Mile Radius
Overflow truckers typically divert 3–7 miles when primary choice is full. We search for parcels with strong ingress/egress within this radius.
Quantify Overflow Demand
We estimate monthly overflow (trucks turned away) and map that to gallons proxy. This becomes the demand baseline for Getty underwriting.
Validate with HPMS
Corridor flow must support dual facilities. We cross-check cohort data against HPMS to ensure supply gap is real, not algorithmic noise.
Score Real Estate Fundamentals
Candidate parcels must pass Getty's fallback-use test: strong corner, visibility, ingress/egress, and alternative-use flexibility.
Deliver Getty-Ready Package
Site brief includes saturation curves, overflow quantification, gallons proxy, and competitive analysis—all transparently auditable.
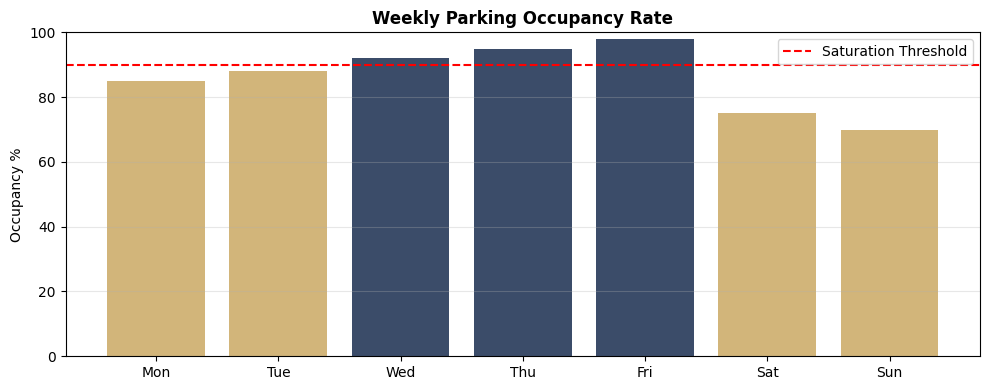
Sample Visualization: Competitive Saturation Analysis
Interpretation: This sample corridor shows consistent 90%+ occupancy Wed–Fri at the primary facility (blue bars). Secondary facility (gold bars) shows moderate saturation, indicating market can support additional capacity.
Getty IC Insight: The red saturation threshold line indicates when overflow demand becomes statistically significant. Three consecutive nights above this threshold validates co-location opportunity.
How This De-Risks Getty Development
Traditional Underwriting Challenge
- Parking demand is invisible in HPMS data
- Site visits capture single snapshots, miss weekly patterns
- Anecdotal trucker feedback lacks statistical rigor
- Getty IC must rely on developer intuition vs. data
- Re-tenant risk if operator changes: unproven location fundamentals
Milepost Saturation Module Solution
- Continuous monitoring of 1,800 parking sub-polygons
- Statistical confidence from 180,000-device cohort
- Hourly + weekly patterns reveal true demand
- Overflow quantification provides Getty IC with transparent validation
- Re-tenant advantage: data-proven flows shorten timeframes, ease new operator attraction
The Getty Advantage
Parking saturation is the single strongest leading indicator of immediate truck-stop development opportunity. By combining:
- Manual parking sub-polygon geofences (1,800 facilities)
- 180,000-device trucker cohort mobility
- Overnight dwell detection algorithms
- HPMS corridor flow validation
Milepost delivers Getty-ready opportunities with the lowest underwriting risk profile in the industry.
See How We Align With Getty's Investment Philosophy
Explore how our data-driven approach matches Getty's risk posture and portfolio strategy.
Getty Alignment